While working on my ASP.NET Core Web API project, I hit a wall with local debugging. In production, I had Amazon CloudWatch — searchable, filterable, color-coded logs. Locally? A wall of console text that was nearly impossible to trace through. I needed something that gave me CloudWatch-level visibility on my own machine.
That’s when I found Seq. Paired with Serilog for structured logging, it gave me a clean, searchable dashboard for local development — and the setup took less than fifteen minutes.
Here’s the full walkthrough. You can grab the code from GitHub.
Why Serilog and Seq?
Serilog captures logs as structured data rather than plain text — meaning you can filter by request ID, log level, user ID, or any property you enrich your logs with. Seq takes that structured data and presents it in a dashboard with real-time search.
Why this combination works for me:
- Structured logging — filter by any field, not just text search
- Centralized dashboard — all logs in one place with color-coded severity
- Fast search — Seq lets me find the exact error in seconds
- Docker-based — consistent setup, runs anywhere
- Rich context — Serilog enrichers add machine name, thread ID, environment automatically
- Lightweight — doesn’t slow down my app, free for local dev
Step 1: Create the Project
| |
This scaffolds a basic Web API with a sample WeatherForecast controller. We’ll add structured logging on top.
Step 2: Install NuGet Packages
| |
Serilog.AspNetCore— hooks Serilog into the ASP.NET Core pipelineSerilog.Sinks.Console— console output for all environmentsSerilog.Sinks.Seq— sends logs to SeqSerilog.Exceptions— detailed exception info including stack tracesSerilog.Enrichers.Environment— adds machine name and environmentSerilog.Enrichers.Thread— adds thread IDs for tracking concurrent operations
Step 3: Run Seq in Docker
Make sure Docker Desktop is running, then:
| |
Navigate to http://localhost:5341 — you should see the Seq dashboard. That’s it. Seq is ready to receive logs.
Step 4: Configure Serilog in Program.cs
| |
The key decision here: Seq only runs in DEBUG mode. In production, you’d point to a different Seq instance with API keys and retention policies. For local dev, the free single-user license is perfect.
Step 5: Create a Controller with Log Levels
I created a LogController.cs with endpoints that demonstrate each log level:
| |
Notice the structured log templates — {Endpoint}, {UserId}, {Setting} become searchable properties in Seq, not just interpolated strings.
Step 6: Run and Test
| |
Hit these endpoints:
https://localhost:<port>/api/log/infohttps://localhost:<port>/api/log/warninghttps://localhost:<port>/api/log/error
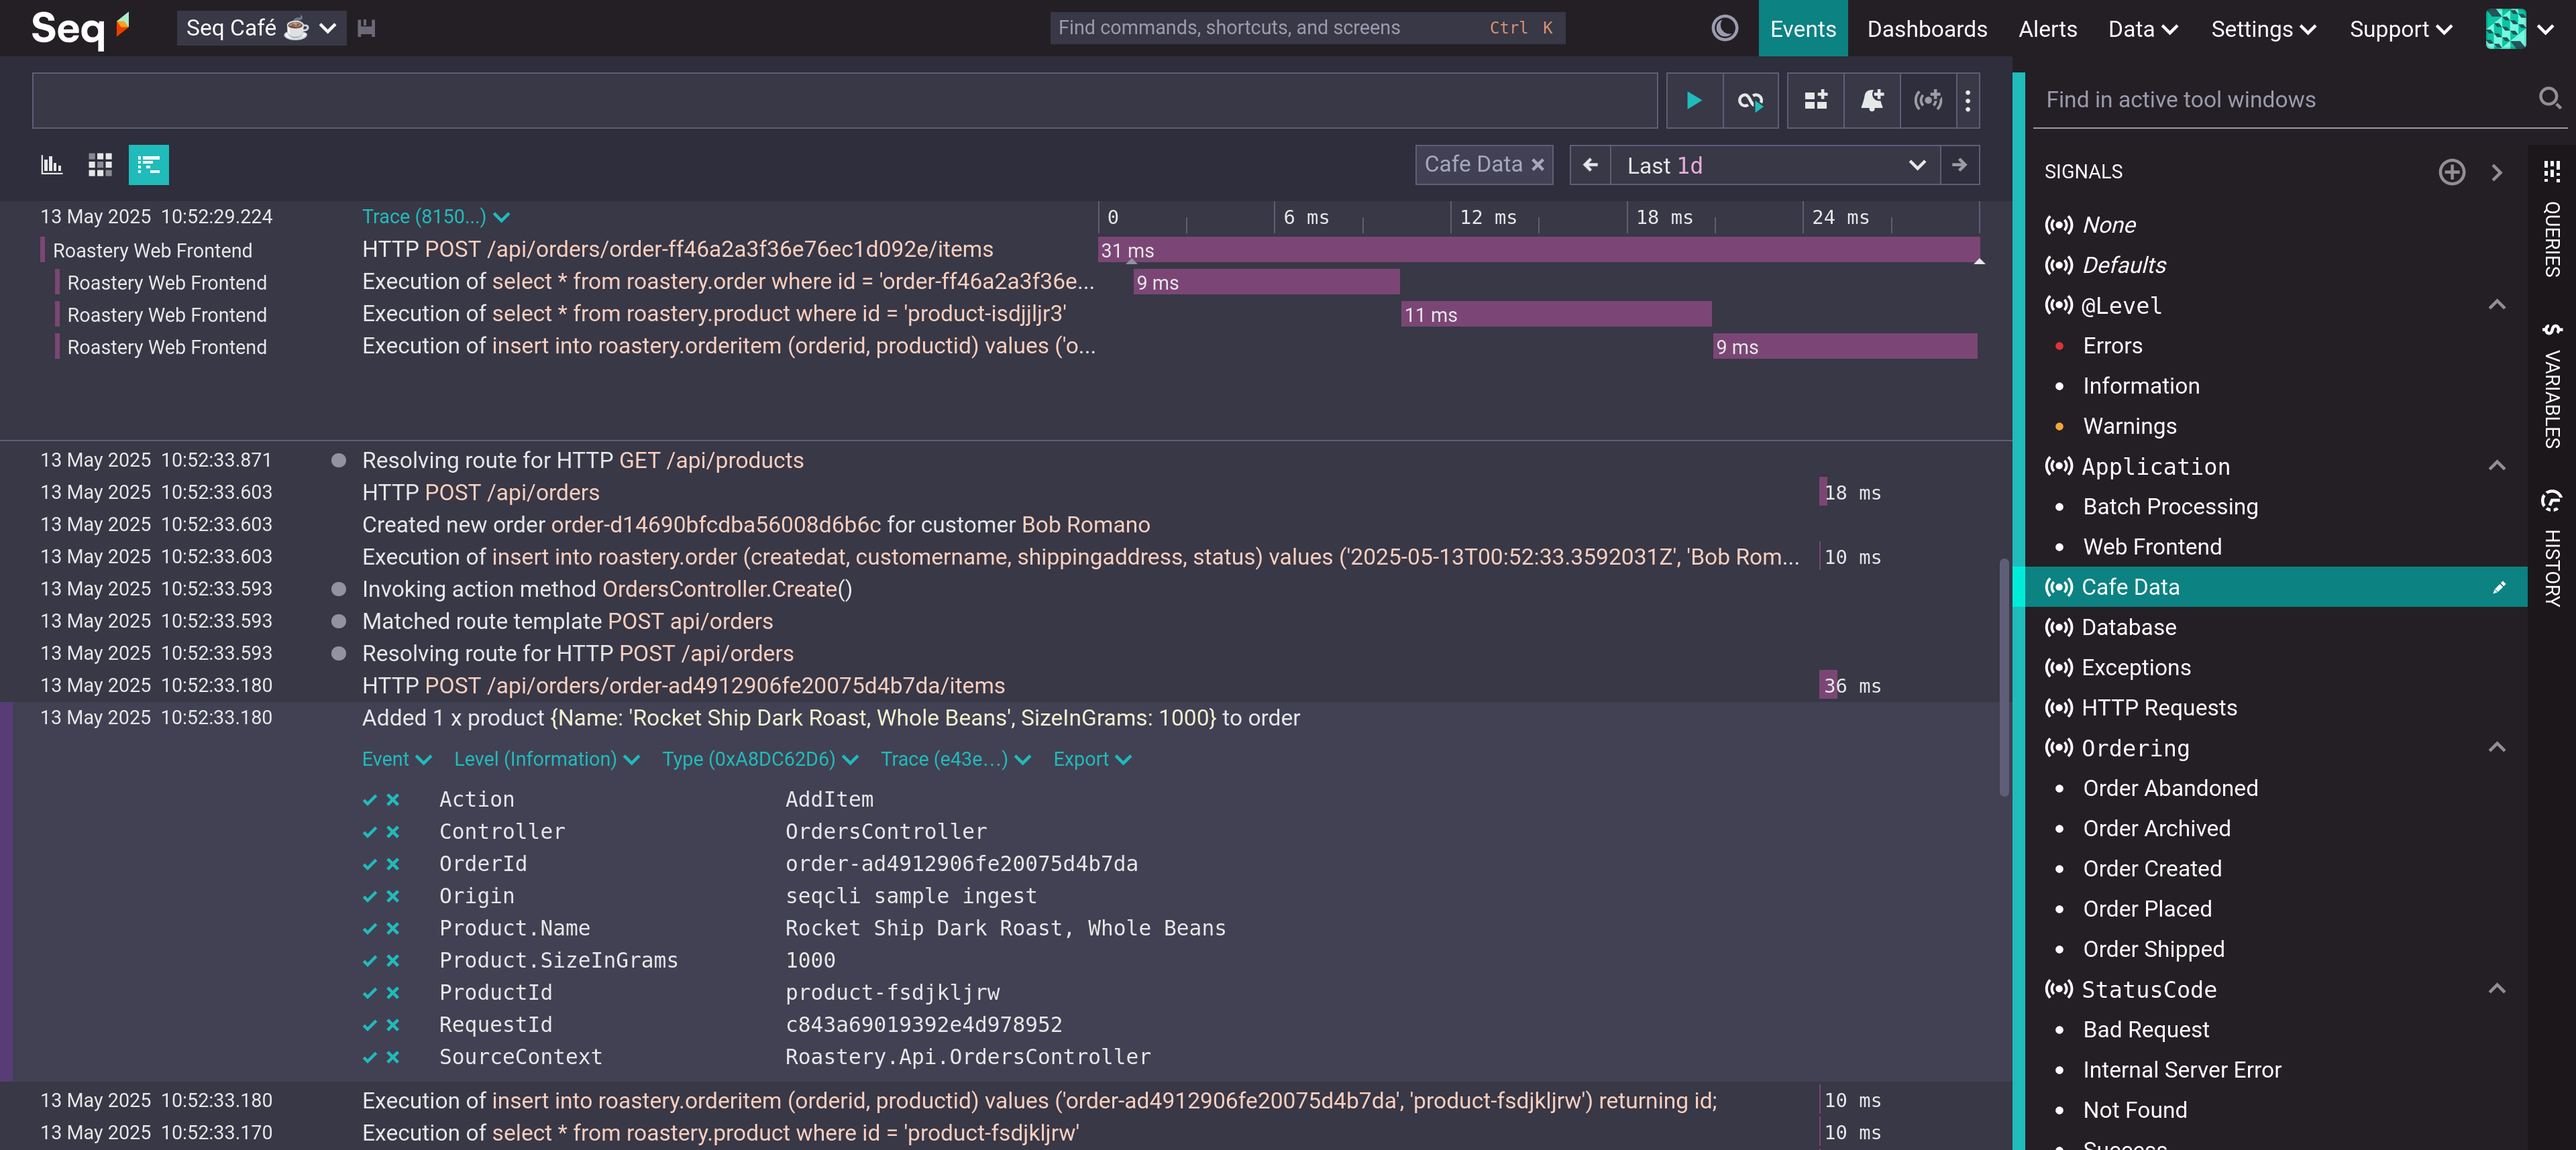
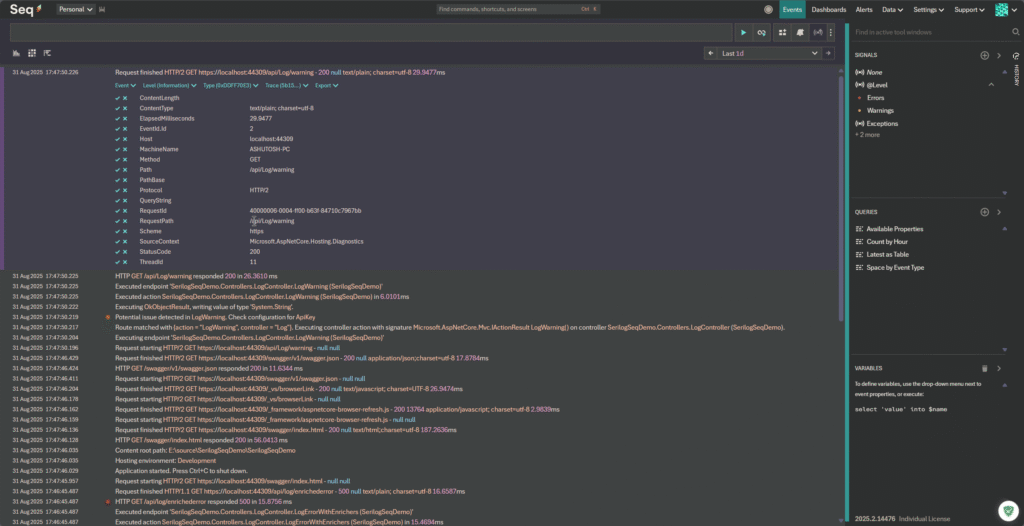
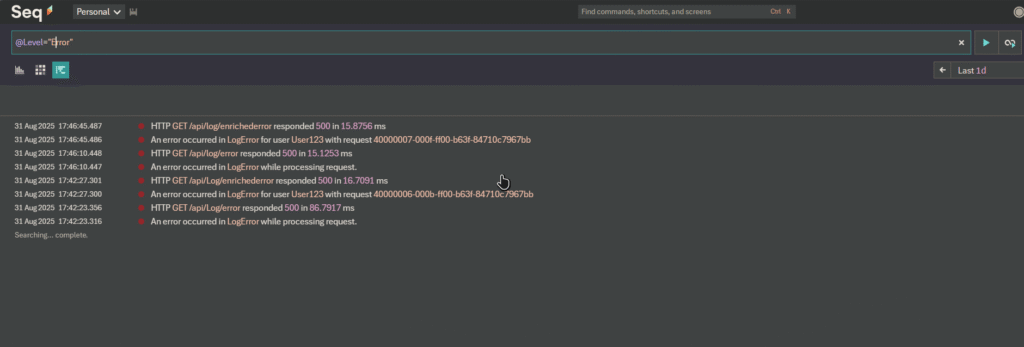
Open Seq at http://localhost:5341 and you’ll see each log entry with full structured data — endpoint name, user IDs, environment, thread IDs. Use Seq’s query bar to filter: Level = "Error" shows only errors, Endpoint = "LogInformation" narrows to specific endpoints.
Step 7: Enhance with Enrichers
For richer error context, add more properties to your log calls:
| |
Now Seq shows the full picture: stack trace, user ID, request trace identifier, environment name, and thread ID — all filterable.
The Payoff
This setup gave me CloudWatch-level observability on my local machine. Debugging went from “scroll through console hoping to spot the error” to “type a query, find the exact log entry, see full context.” The fifteen-minute setup has saved me hours.
The full source is on GitHub. For production deployment, check the Seq documentation for API key configuration and retention policies.